Power BI · Automotive Analytics · Portfolio Project
Renault Morocco
Automotive Sales Dashboard
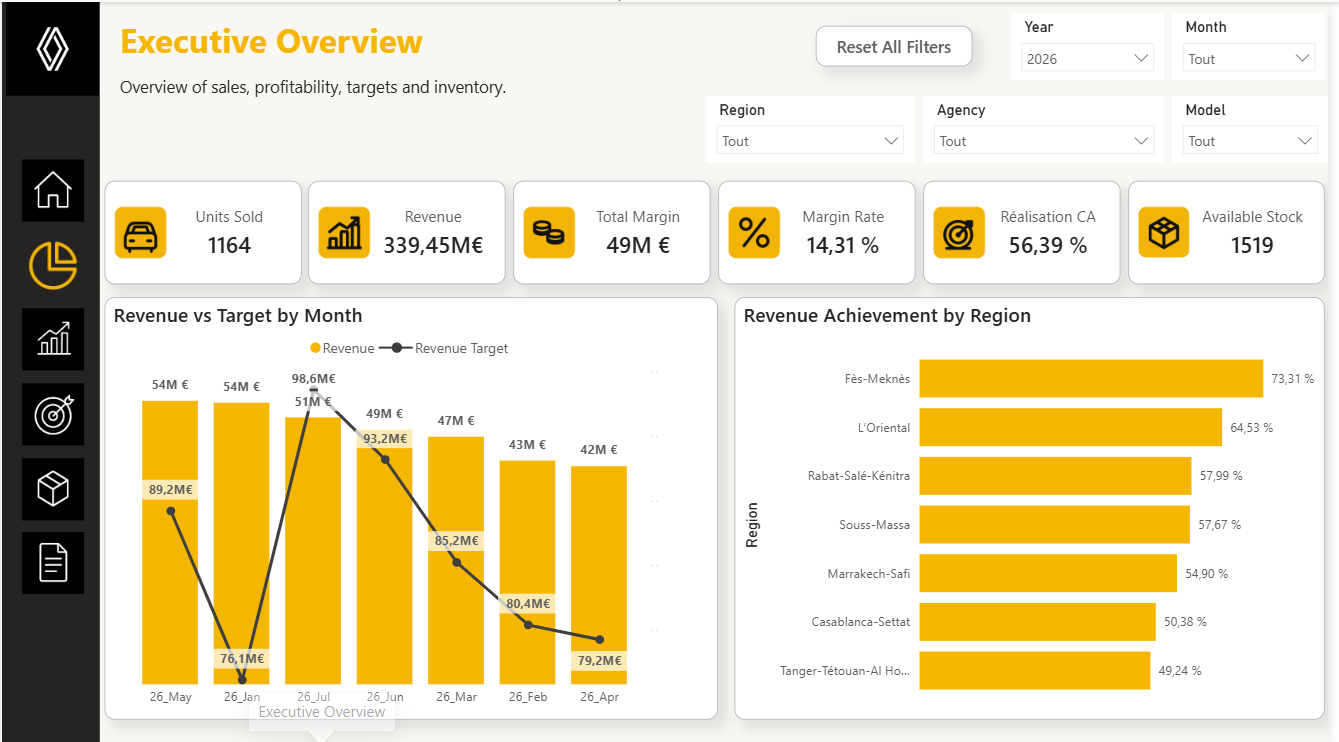
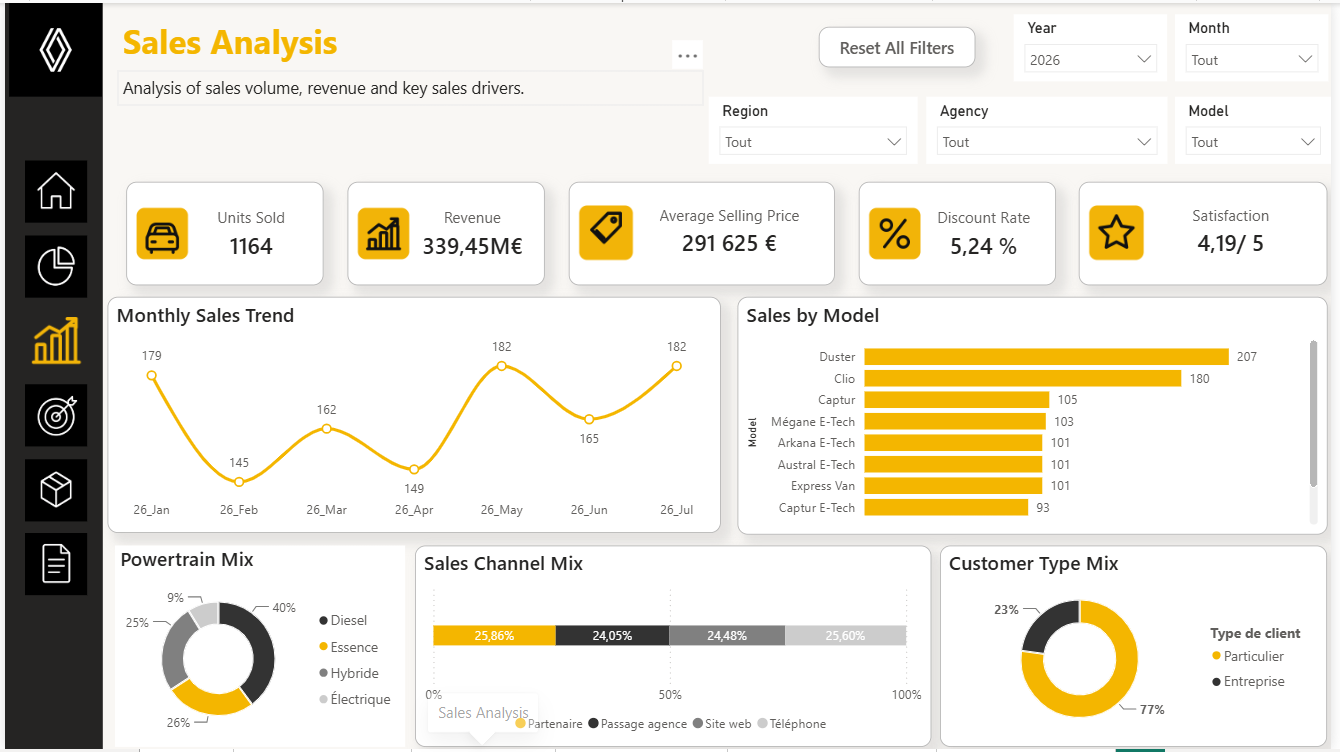
An end-to-end Power BI project focused on automotive sales performance in Morocco. The report covers commercial performance, targets, profitability, inventory and KPI documentation.

Project context
Business need
Create a single decision-making view to analyse sales, revenue, margin, discounts, commercial targets and inventory availability by period, region, dealership and model.
BI approach
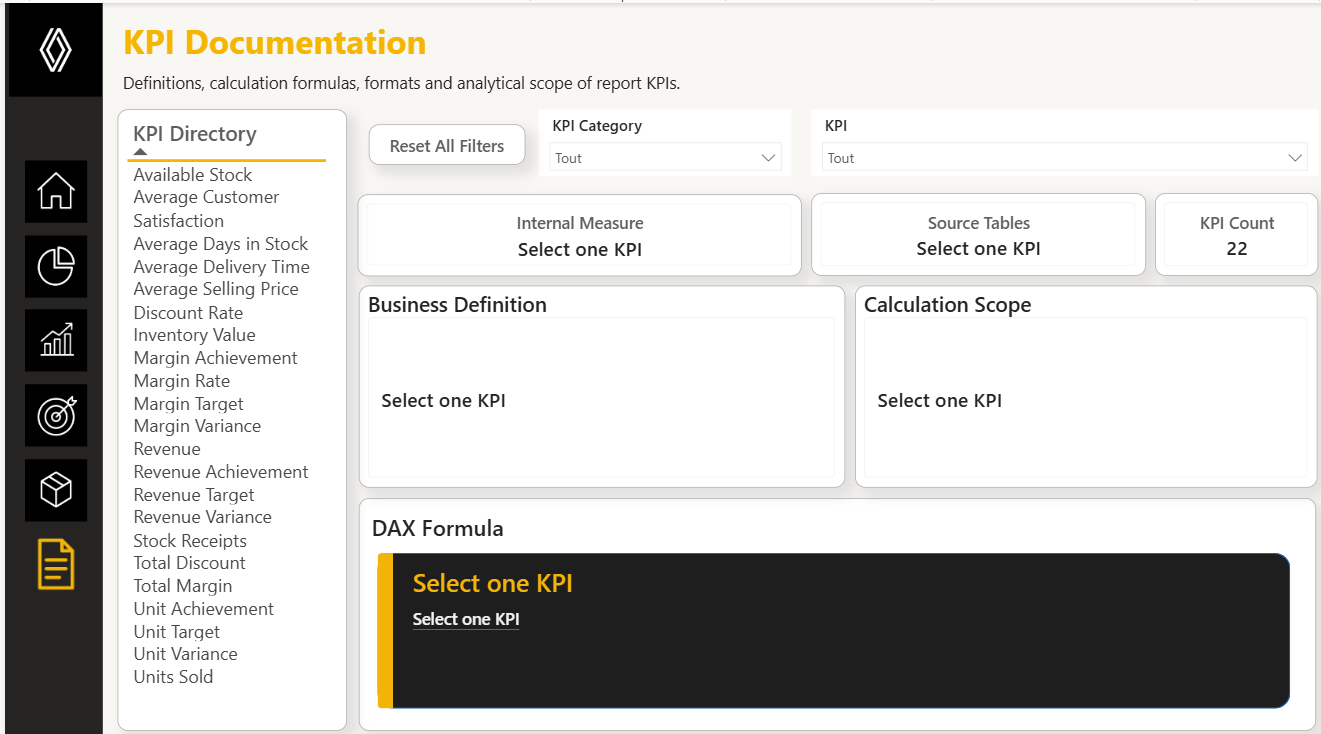
Build an analytical Power BI model with data preparation, DAX measures, consistent business filters, multi-page navigation and centralised KPI documentation.
Key metrics
SalesUnits Sold
RevenueRevenue
ProfitabilityTotal Margin
ProfitabilityMargin Rate
PricingAverage Selling Price
DiscountDiscount Rate
CustomerAverage Satisfaction
InventoryAvailable Stock
InventoryInventory Value
InventoryAverage Days in Stock
TargetsRevenue Achievement
Governance22 documented KPIs
Technical highlights
Data model & calculations
Commercially oriented data model with DAX measures for sales, margins, discounts, targets and variances, plus analysis by year, month, region, dealership and model.
User experience & analysis
Six business pages, global filter reset, regional and sales-representative analysis, and dynamic KPI documentation including DAX formulas.
Technical challenges
Unifying commercial analysis
Challenge: analyse sales, revenue, margin, discounts, targets and inventory consistently across multiple business dimensions.
Solution: an analytical Power BI model, Power Query transformations and DAX measures with shared filters by period, region, dealership and model.
Result: a consolidated view of commercial performance and profitability.
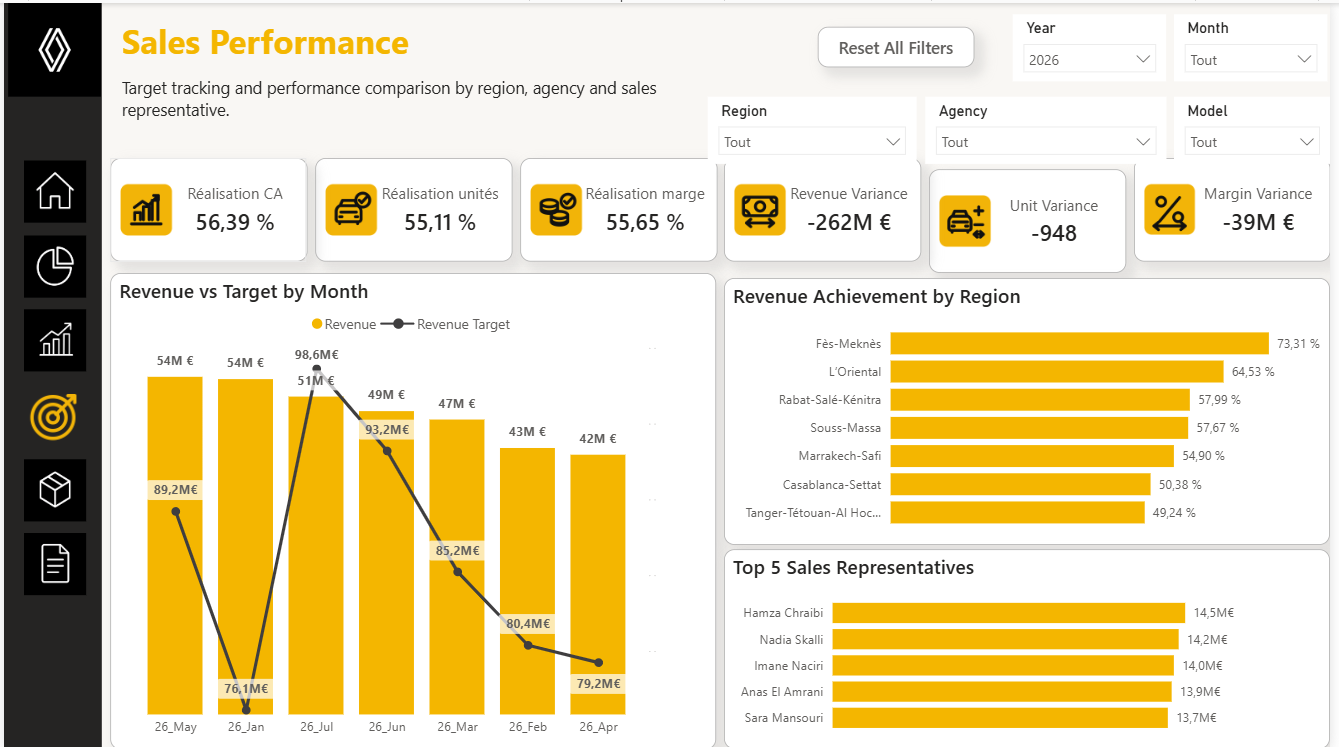
Actual vs Target analysis
Challenge: make target variances immediately interpretable.
Solution: dedicated DAX measures for targets, achievement and variances integrated into performance views.
Result: faster identification of gaps by region and sales representative.
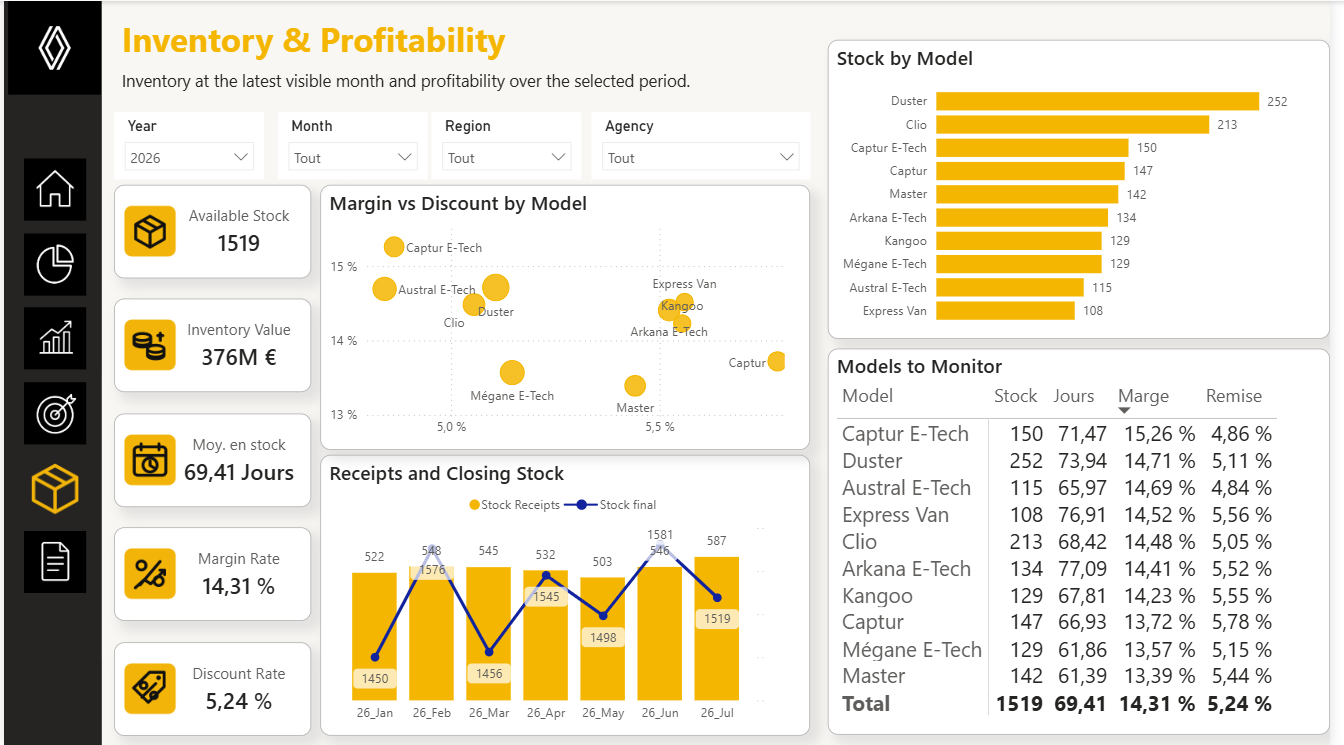
Connecting inventory and profitability
Challenge: avoid analysing inventory, discounts and margin in isolation.
Solution: an Inventory & Profitability page combining availability, stock rotation, inventory value, margin and discounts.
Result: easier identification of models requiring commercial or inventory attention.
Analytical insights
Performance vs targets
The report makes it possible to identify regions and sales representatives contributing to gaps between actual performance and targets, then explore those variances by period and model.
Inventory & margin
Combining stock rotation, discounts and margin helps identify models requiring attention and analyse whether commercial pressure is affecting profitability.
Dashboard pages