Power BI · Contact Center Analytics · Customer Experience
Customer Care 360
Contact Center Performance Analytics
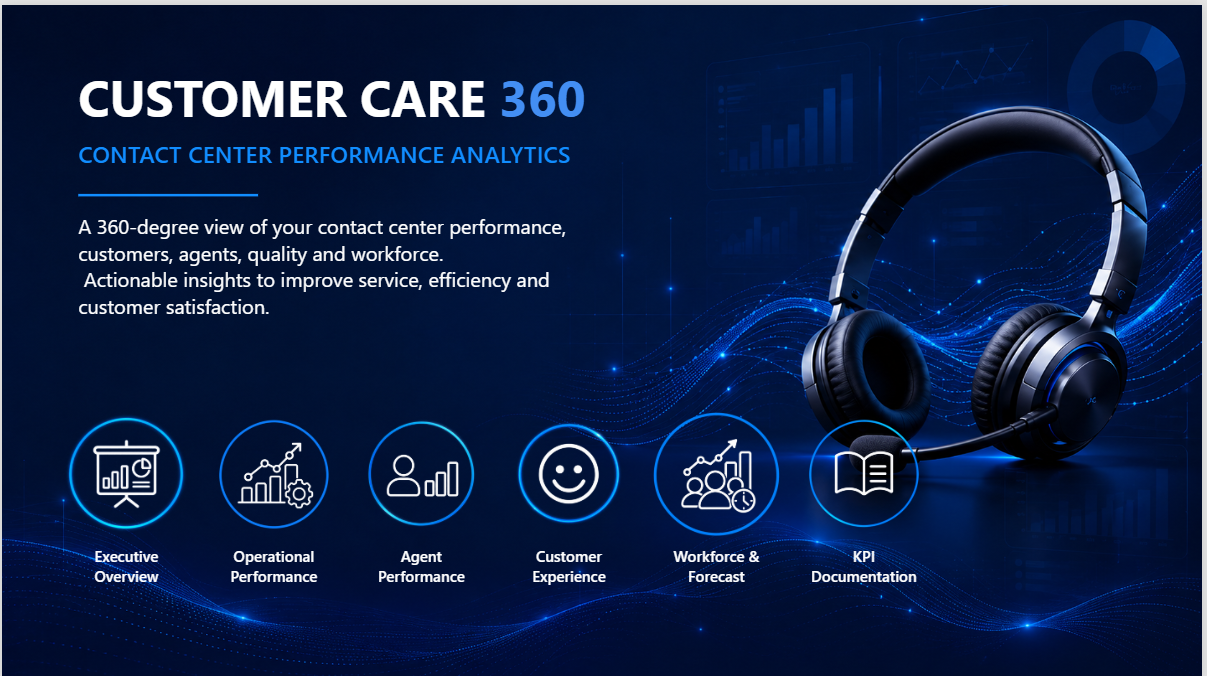
A 360° Power BI solution designed to analyse contact-centre operations, agent performance, customer experience and quality through a consistent analytical model.
Project context
Business need
Bring together operational interactions, agent activity, quality assessments, customer surveys and workforce data in a consistent management view.
BI approach
Use a multi-fact Power BI model with shared dimensions, Power Query transformations, DAX measures and controlled KPI definitions.
Key metrics
OperationsAHT
OperationsACW
OperationsHold Time
ServiceFCR
CustomerCSAT
CustomerNPS
QualityQuality Score
AgentsProductivity
WorkforceAdherence
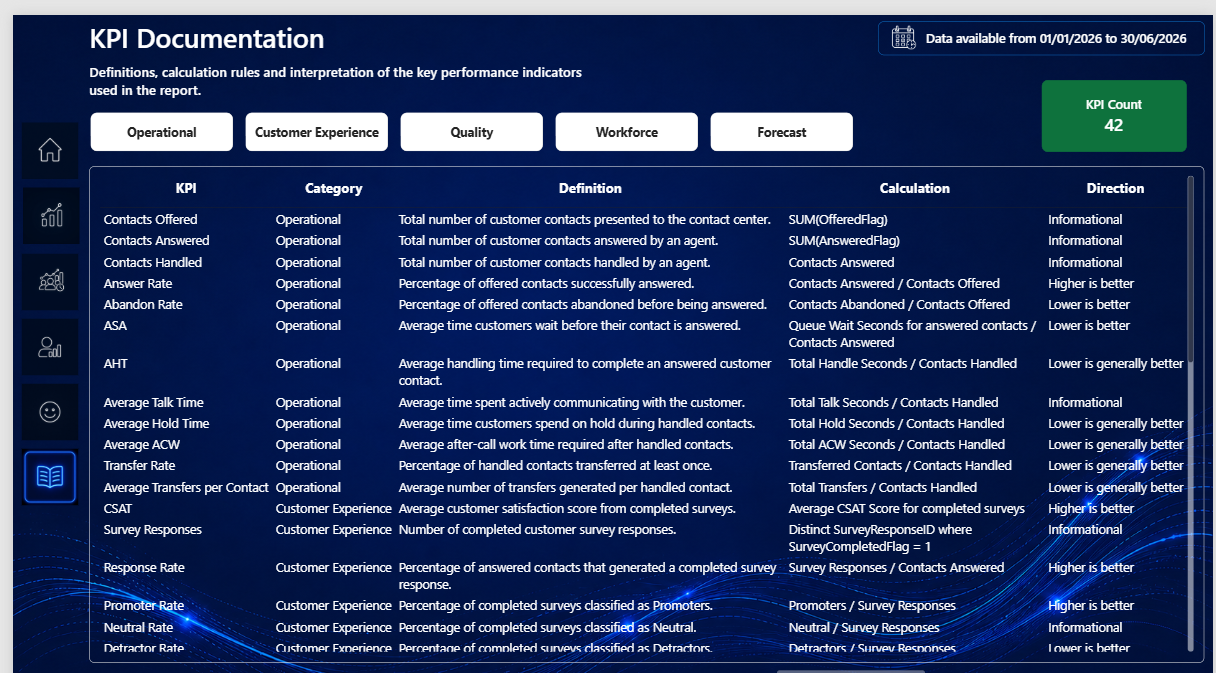
GovernanceKPI Documentation
Technical highlights
Data model & calculations
Multi-fact model with shared dimensions and explicit grains to protect KPI accuracy and prevent double counting across operational, survey, quality and workforce data.
User experience & analysis
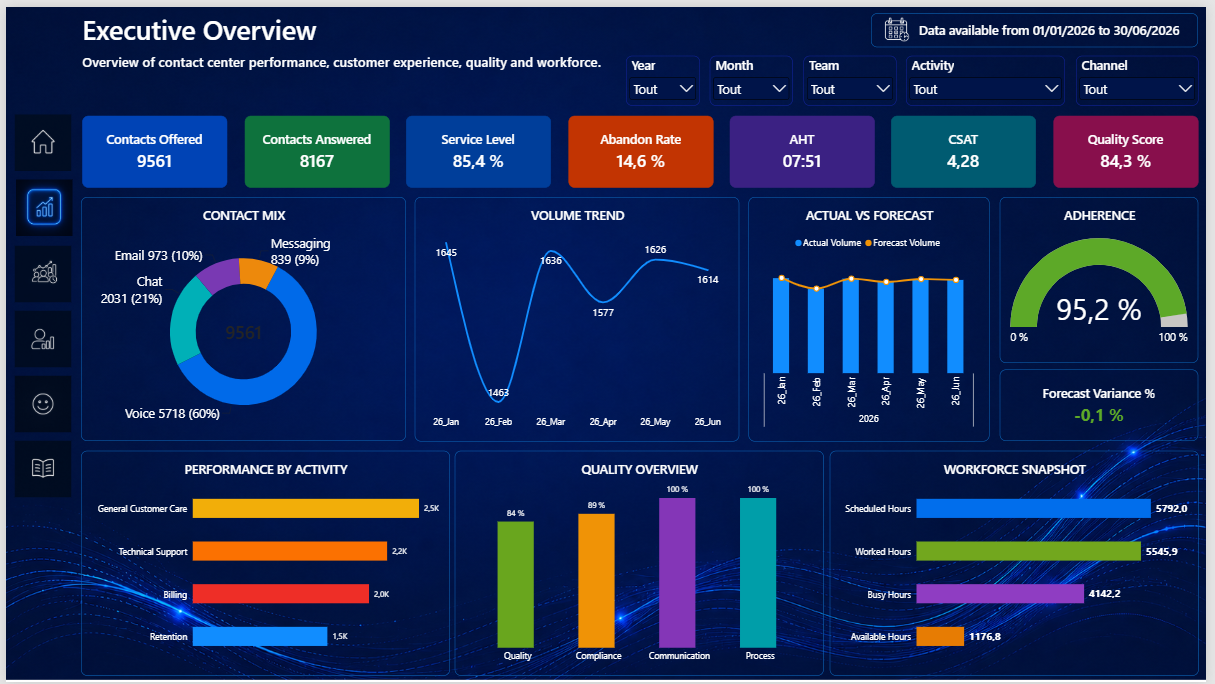
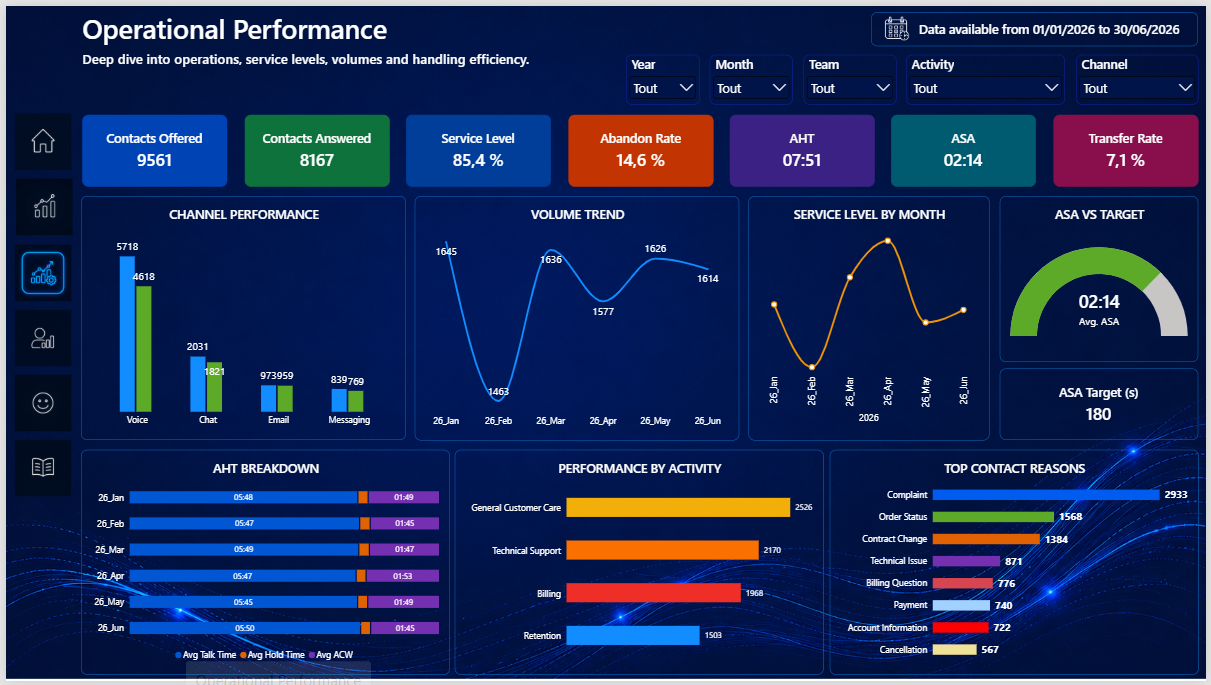
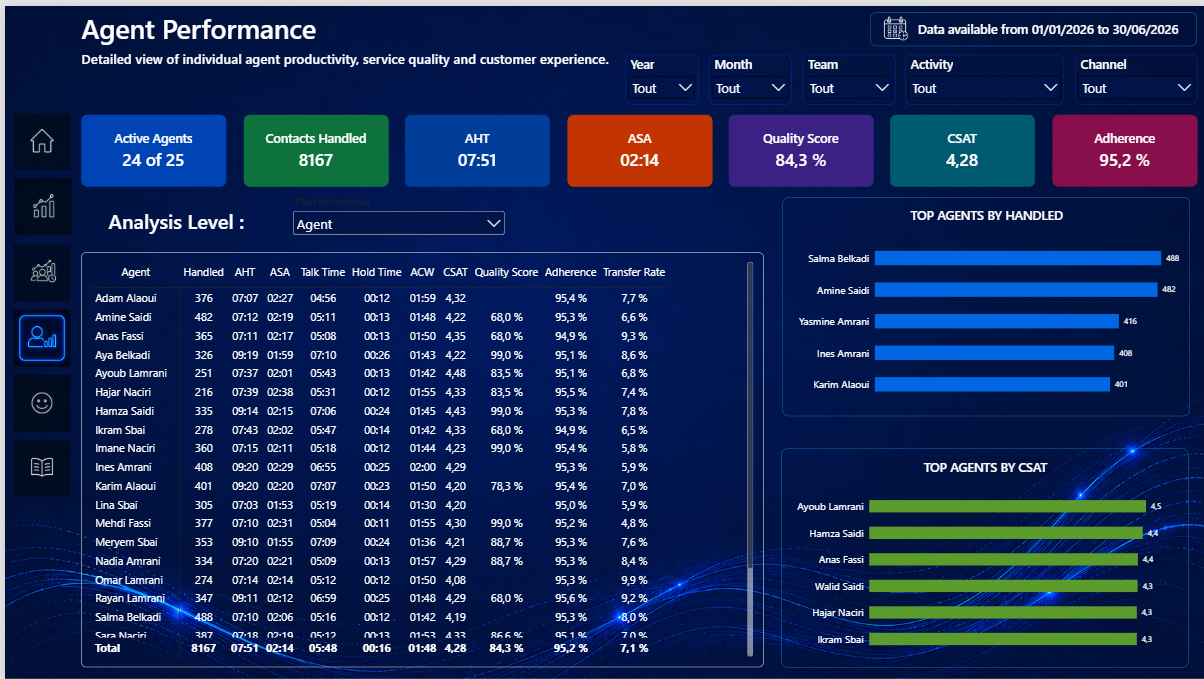
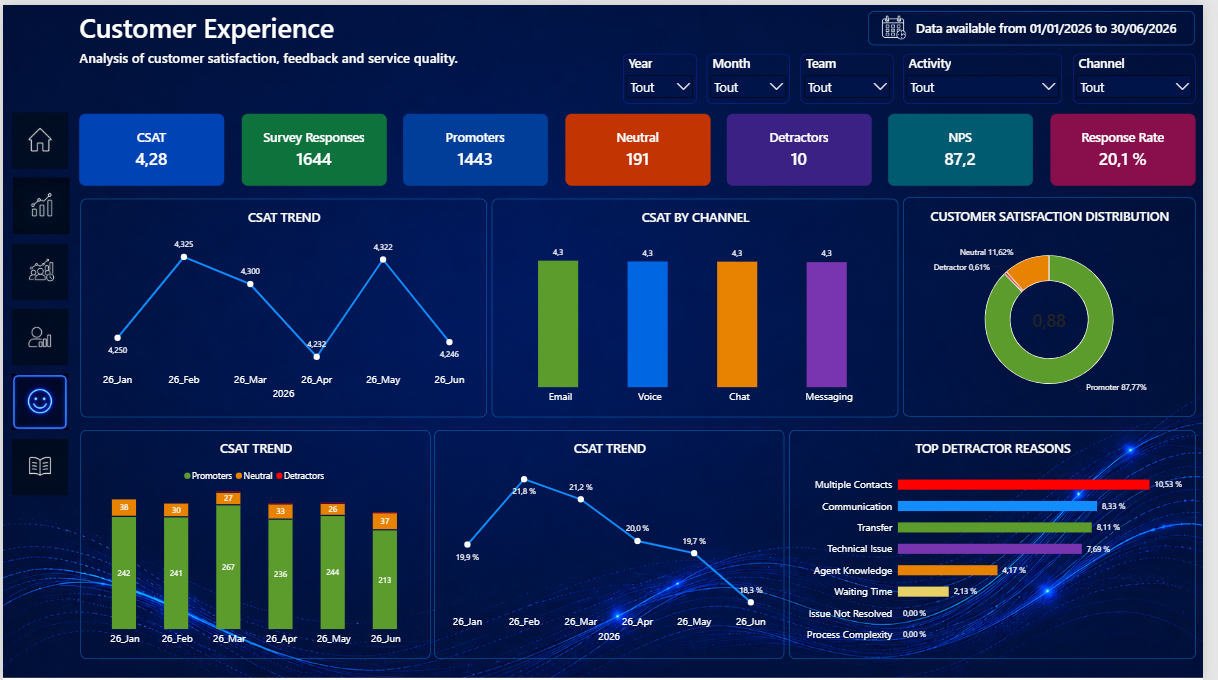
Multi-page navigation from executive monitoring to operational, agent and customer-experience analysis, supported by documented KPI definitions.
Technical challenges
Combining different data grains
Challenge: operational, survey, quality, workforce and forecast data do not share the same level of granularity.
Solution: a multi-fact architecture with shared dimensions, explicit grain control and one-to-many relationships.
Result: consistent KPIs without double counting across analytical sources.
Protecting KPI reliability
Challenge: duplicates, null values, keys and cardinalities can distort indicators.
Solution: Data Quality controls and validation of keys, duplicates, nulls and model relationships.
Result: a more reliable foundation for DAX measures and operational analysis.
Standardising KPI governance
Challenge: contact-centre KPIs can be interpreted differently by users.
Solution: centralised KPI documentation covering definitions, calculation rules, formats and interpretation.
Result: a common analytical reference for performance management.
Analytical insights
Efficiency & customer experience
The model supports combined analysis of handling-time, service, satisfaction, NPS and quality indicators to identify situations where operational efficiency and customer experience move differently.
Forecast & workforce
Comparing forecast, actual volumes and adherence makes it possible to explore workload variances and their relationship with team performance.
Dashboard pages